Fungicide Applications to Grain Corn by DEKALB® Brand Corn Product
July 25, 2022
Trial Objective
- To help determine if there is a positive response to yield potential by applying a foliar fungicide on the newest DEKALB® brand corn products.
- Data from the trial can help DEKALB® agronomists provide fungicide recommendations by corn product.
- Corn products vary in their genetic tolerance, resistance, or lack of, to different foliar diseases. Foliar fungicides can help maintain viable leaf tissue when corn products lack disease tolerance; however, can fungicides provide a benefit when corn products have tolerance or resistance to certain foliar diseases?
Experiment/Trial Design
- Long-term fungicide application trial – at minimum of two years with data from 7 to 8 sites. A third year of data may be available for corn products with a longer life span.
- Group block design with fungicide as the main unit and corn product as the sub-unit.
- Untreated check
- Delaro® Complete Fungicide applied at pre-tassel using a back-pack sprayer and high clearance boom + Turbo TwinJet nozzles (Figure 1).
- Applied at a rate of 586 ml/hectare (237 ml/acre) in a water volume of 150 to 200 l/hectare.
- Stratego® PRO fungicide applied at pre-tassel using a back-pack sprayer and high clearance boom + Turbo TwinJet nozzles (Figure 1).
- Applied at a rate of 572 ml/hectare (231.5 ml/acre) in a water volume of 150 to 200 l/hectare.
- Three replications.
- Plot size, 10 ft x 23 ft.
- Targeted final population of 35,000 plants/acre.
- 2 to 7 DEKALB® brand corn products per set (Figure 1).
- Evaluations:
- R3 to R5 growth stage:
- Final stand count (FNSC)
- Disease stressor classification (DISEA)
- R5 growth stage:
- Staygreen (STGRN)
- Harvest:
- Root lodging count (RTLC)
- Stalk lodging count (STLC)
- Intactness above the ear (INT)
- Shell weight (SHW)
- Percent moisture content (MST)
- Test weight (TWT)
- R3 to R5 growth stage:

Understanding the Results
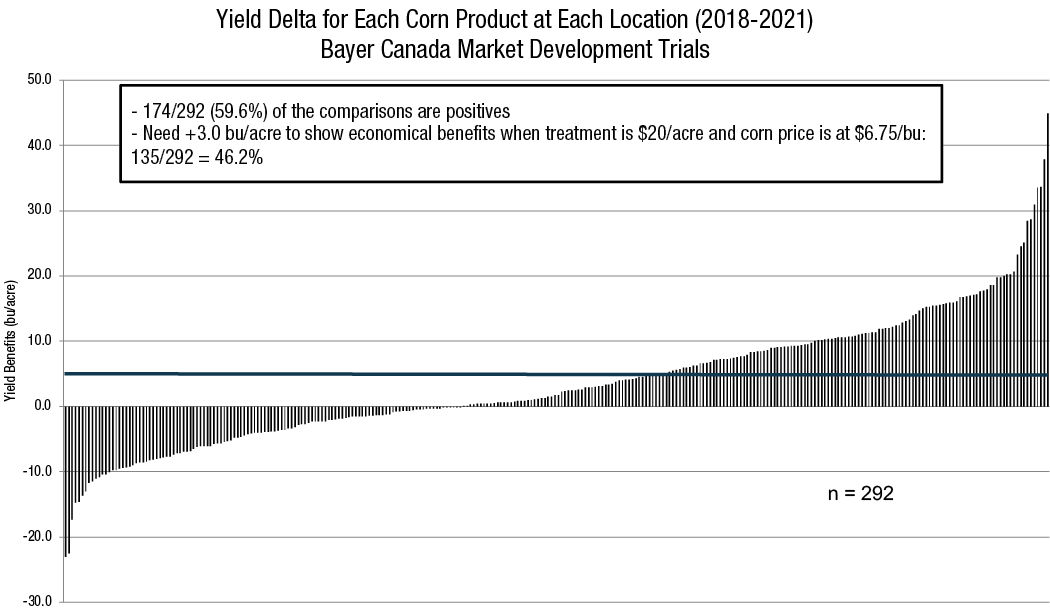
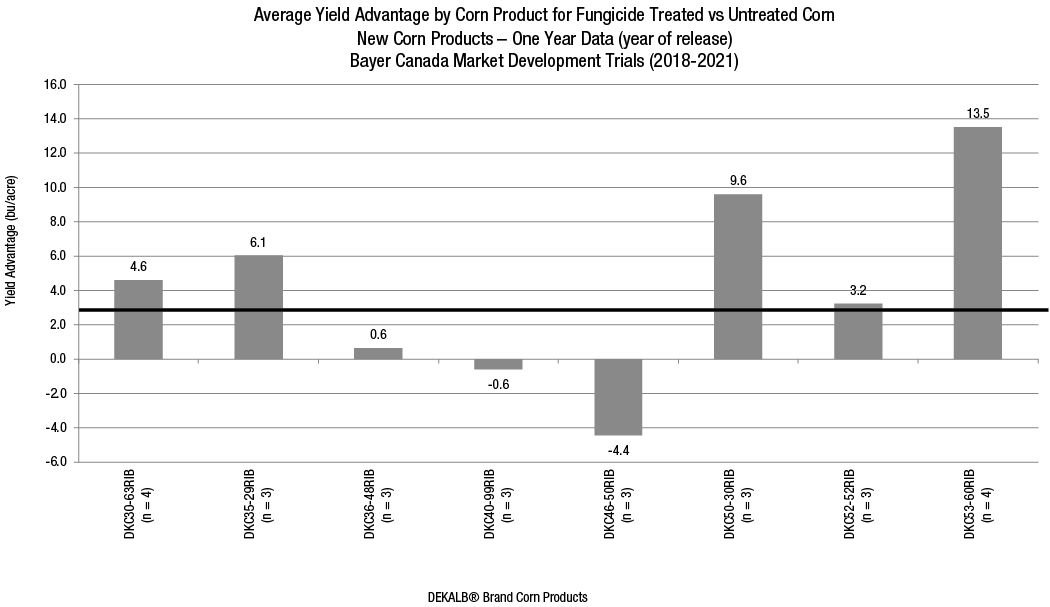
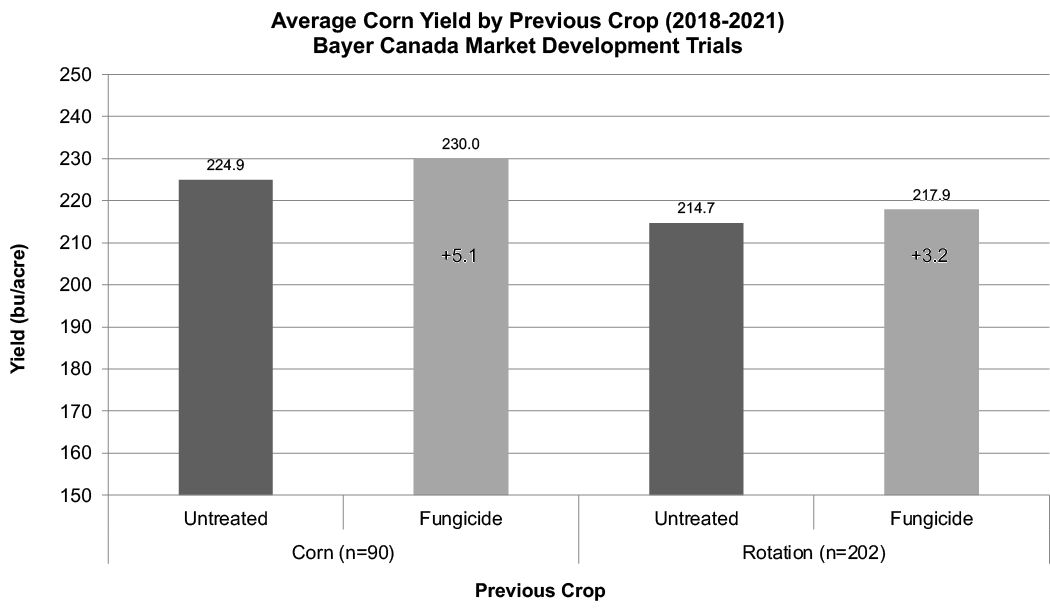
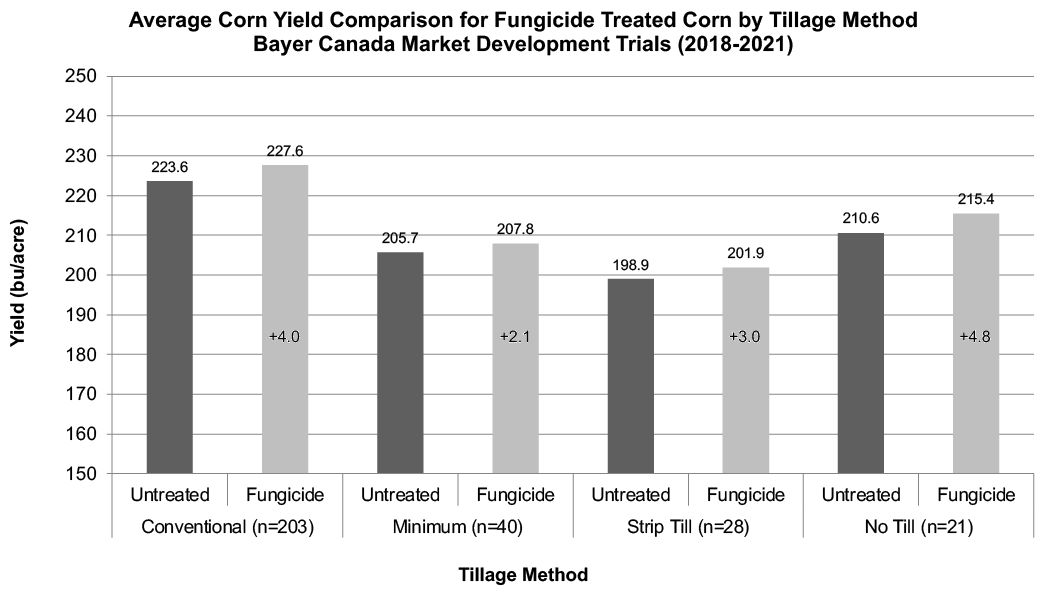
- Compared to the untreated checks, fungicide-treated corn in the years 2018 to 2021 showed a positive average yield response of 3.7 bu/acre (Figures 2 and 3).
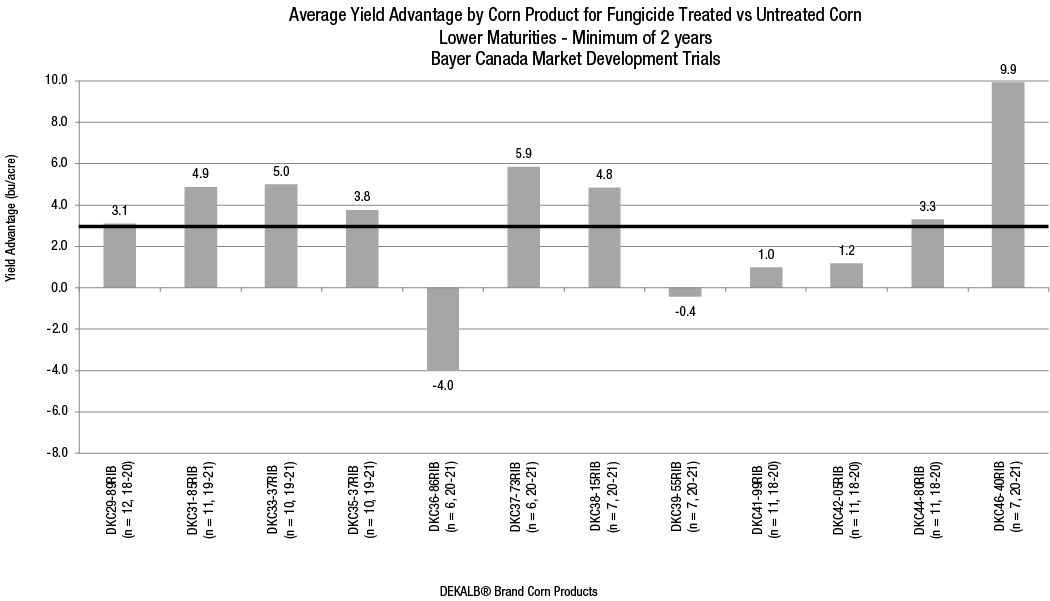
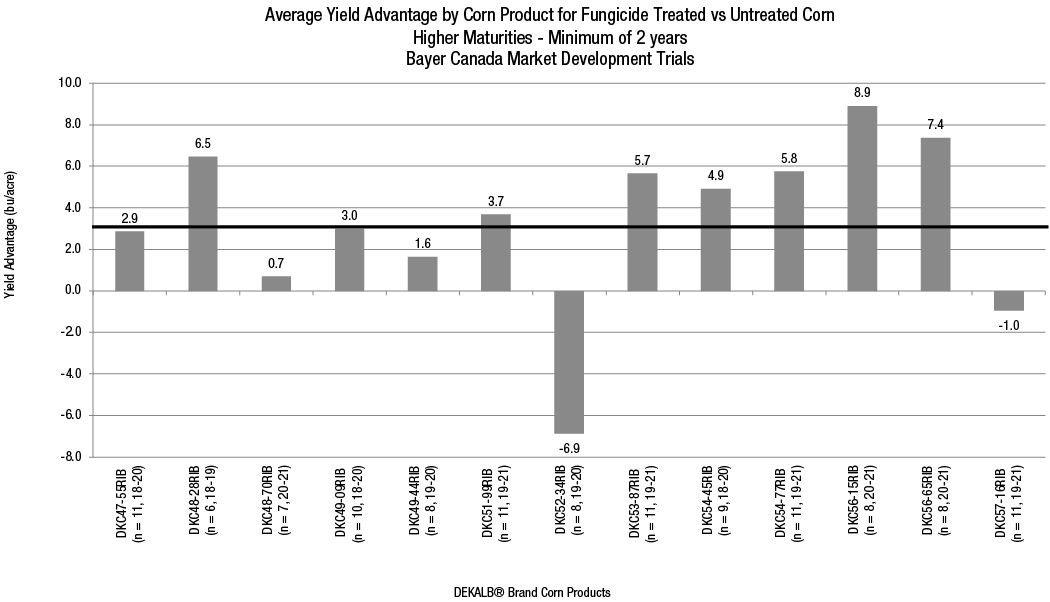
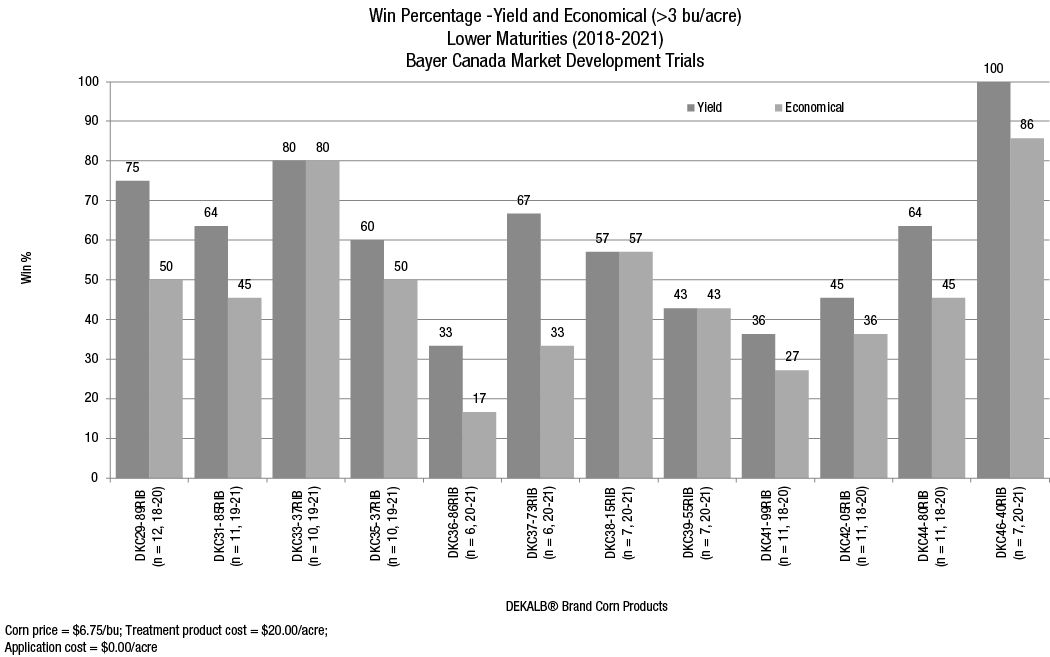
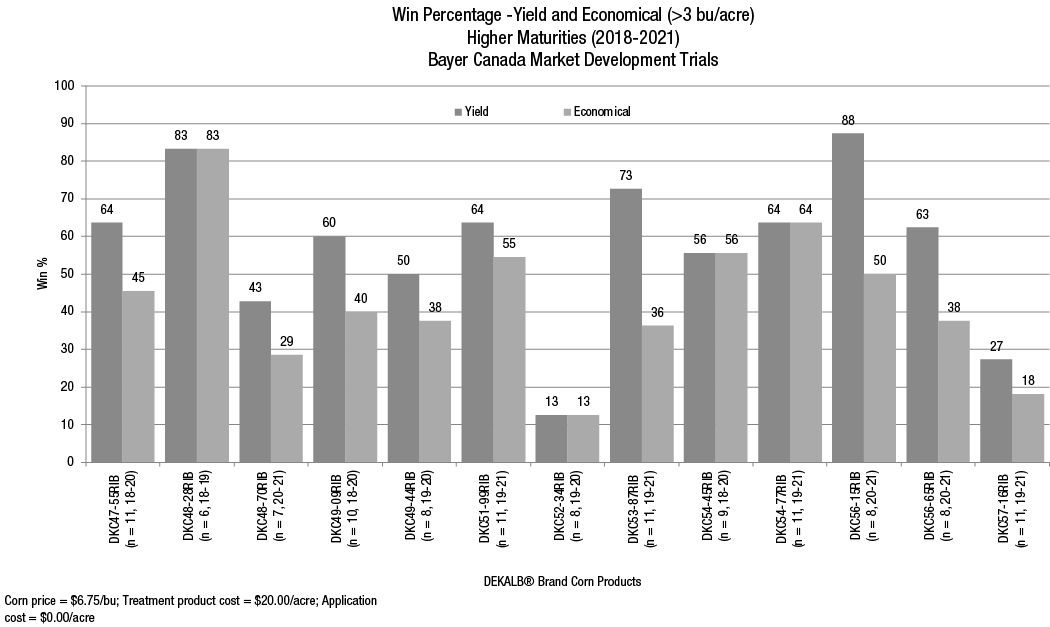
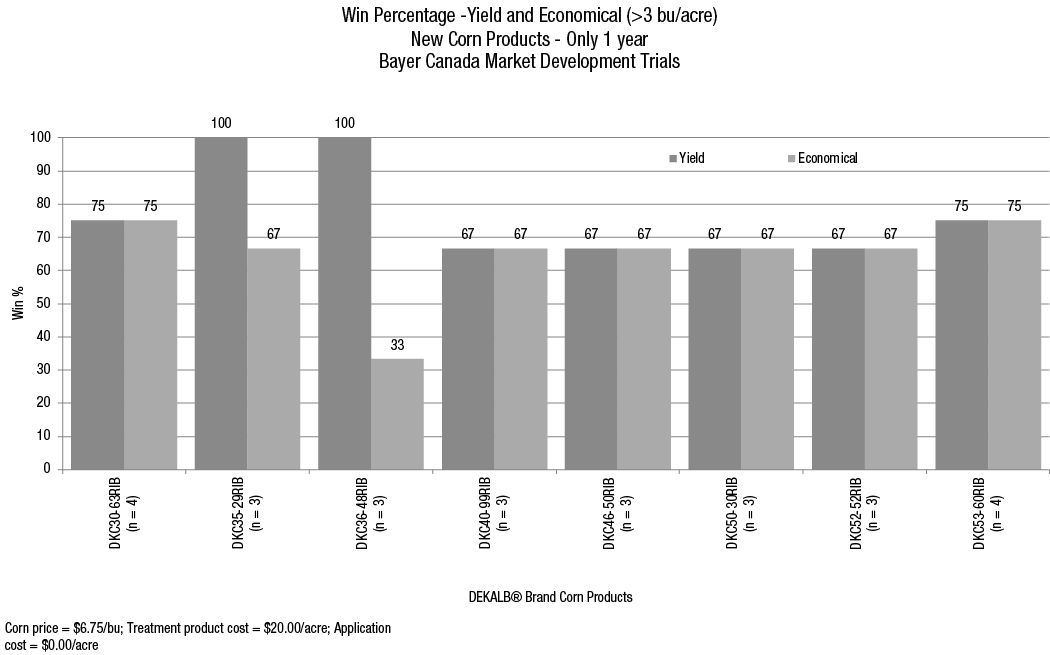
- To have a positive response to ROI, the cost of a fungicide and its application should maintain a minimum of 3 bu/acre of yield potential. 16 of the 25 corn products met or exceeded this economical threshold (Figures 4, 5, and 6).
- 21 of the 25 corn products showed a yield increase when a fungicide was utilized (Figures 5 and 6).
- Seasonal growing conditions play a role in the yield response to fungicides. The highest response since 2018 occurred in 2021 with an average increase of 8.5 bu/acre.
| Year | Untreated Check / Fungicide | n = | HVPOP (1000 plants/acre) | STGRN (1-9) | RTLP (%) | STLP (%) | INT (1-9) | MST (%) | TWT (lb/bu) | YLD (bu/acre) | |
|---|---|---|---|---|---|---|---|---|---|---|---|
| 2018 | Untreated | 51 | 36.1 | 5.7 | 1.8 | 4.0 | 3.6 | 22.8 | 55.1 | 216.9 | B |
| Stratego® PRO | 51 | 35.7 | 5.5 | 0.7 | 3.2 | 3.7 | 22.9 | 55.6 | 219.8 | A | |
| Delta | 51 | -0.4 | -0.2 | -1.1 | -0.8 | 0.1 | 0.1 | 0.5 | 2.9 | ||
| 2019 | Untreated | 70 | 35.2 | 4.7 | 0.4 | 2.0 | 4.8 | 27.4 | 52.4 | 214.5 | A |
| Stratego® PRO | 70 | 34.9 | 4.3 | 0.5 | 1.8 | 4.6 | 27.4 | 52.4 | 215.3 | A | |
| Delta | 70 | -0.3 | -0.4 | 0.1 | -0.2 | -0.2 | 0.0 | 0.0 | 0.8 | ||
| 2020 | Untreated | 90 | 33.3 | 4.4 | 0.8 | 0.3 | 3.8 | 22.5 | 53.3 | 199.4 | A |
| Delaro® Complete | 90 | 33.2 | 4.2 | 0.6 | 0.3 | 3.7 | 22.5 | 53.4 | 201.4 | A | |
| Delta | 90 | -0.1 | -0.2 | -0.2 | 0.0 | -0.1 | 0.0 | 0.1 | 2.0 | ||
| 2021 | Untreated | 81 | 35.6 | 6.7 | 0.9 | 1.2 | 4.5 | 23.7 | 54.5 | 228.2 | B |
| Delaro® Complete | 81 | 35.3 | 6.3 | 1.0 | 1.6 | 4.3 | 23.9 | 54.8 | 236.7 | A | |
| Delta | 81 | -0.3 | -0.4 | 0.1 | 0.4 | -0.2 | 0.2 | 0.3 | 8.5 | ||
| Overall | Untreated | 292 | 34.9 | 5.6 | 0.9 | 1.6 | 4.2 | 24.1 | 53.7 | 215.3 | B |
| Fungicide | 292 | 34.6 | 5.3 | 0.7 | 1.5 | 4.1 | 24.1 | 53.9 | 219 | A | |
| Delta | 292 | -0.3 | -0.3 | -0.2 | -0.1 | -0.1 | 0.0 | 0.2 | 3.7 | ||
| RM | Treatment | n = | HVPOP (1000 plants/acre) | STGRN (1-9) | RTLP (%) | STLP (%) | INT (1-9) | MST (%) | TWT (lb/bu) | YLD (bu/acre) | Delta (bu/acre) |
|---|---|---|---|---|---|---|---|---|---|---|---|
| 80 | Untreated | 27 | 34.5 | 4.1 | 0.2 | 1.1 | 3.3 | 24.0 | 52.3 | 183.0 | 4.3 * |
| Fungicide | 27 | 34.3 | 3.7 | 0.2 | 1.8 | 3.0 | 24.2 | 52.5 | 187.3 | ||
| 85 | Untreated | 46 | 34.5 | 5.9 | 0.3 | 0.4 | 4.4 | 24.1 | 54.2 | 208.1 | 3.8 * |
| Fungicide | 46 | 34.4 | 5.6 | 0.5 | 0.5 | 4.3 | 24.2 | 54.5 | 211.9 | ||
| 90 | Untreated | 50 | 35.1 | 5.9 | 0.6 | 1.2 | 4.6 | 21.9 | 54.0 | 204.1 | 1.1 |
| Fungicide | 50 | 34.6 | 5.5 | 0.7 | 0.5 | 4.5 | 22.2 | 54.2 | 205.2 | ||
| 95 | Untreated | 32 | 35.1 | 5.5 | 4.1 | 5.2 | 3.3 | 24.3 | 54.0 | 219.8 | 4.1 * |
| Fungicide | 32 | 34.6 | 5.2 | 1.1 | 2.8 | 3.2 | 24.4 | 54.3 | 223.8 | ||
| 100 | Untreated | 62 | 34.8 | 5.1 | 0.1 | 1.1 | 3.7 | 25.1 | 53.8 | 242.2 | 3.0 |
| Fungicide | 62 | 34.5 | 5.0 | 0.3 | 1.3 | 3.5 | 25.0 | 53.8 | 245.2 | ||
| 105 | Untreated | 75 | 35.0 | 6.8 | 1.3 | 1.6 | 5.0 | 24.6 | 53.5 | 226.0 | 6.4 * |
| Fungicide | 75 | 35.0 | 6.4 | 1.5 | 2.4 | 4.8 | 24.5 | 53.7 | 232.4 | ||
| All | Untreated | 292 | 34.9 | 5.6 | 0.9 | 1.6 | 4.2 | 24.1 | 53.7 | 215.3 | 3.7 * |
| Fungicide | 292 | 34.6 | 5.3 | 0.7 | 1.5 | 4.1 | 24.1 | 53.9 | 219.0 | ||
| * Significant difference (p < 0.05) | |||||||||||
Key Learnings
- The use of a fungicide helps maintain yield potential when labeled foliar diseases develop and growing conditions favor pathogen development, increase, and spread.
- This study showed an average increase of 3.7 bu/acre when a fungicide was used and can be higher when disease incidence is higher.
- Corn products should be evaluated for genetic resistance or tolerance to different foliar diseases. Because of seasonal growing conditions and specific pathogen development, it is difficult to determine which pathogen may or may not be problematic in each growing season.
- Continued research is needed to evaluate the response of newly commercialized corn products to foliar fungicides.
Legal Statements
The information discussed in this report is from a multiple site, replicated demonstration. This informational piece is designed to report the results of this demonstration and is not intended to infer any confirmed trends. Please use this information accordingly.
Bayer is a member of Excellence Through Stewardship® (ETS). Bayer products are commercialized in accordance with ETS Product Launch Stewardship Guidance, and in compliance with Bayer’s Policy for Commercialization of Biotechnology-Derived Plant Products in Commodity Crops. These products have been approved for import into key export markets with functioning regulatory systems. Any crop or material produced from these products can only be exported to, or used, processed or sold in countries where all necessary regulatory approvals have been granted. It is a violation of national and international law to move material containing biotech traits across boundaries into nations where import is not permitted. Growers should talk to their grain handler or product purchaser to confirm their buying position for these products. Excellence Through Stewardship® is a registered trademark of Excellence Through Stewardship.
ALWAYS READ AND FOLLOW PESTICIDE LABEL DIRECTIONS. Performance may vary from location to location and from year to year, as local growing, soil and weather conditions may vary. Growers should evaluate data from multiple locations and years whenever possible and should consider the impacts of these conditions on the grower’s fields.
Bayer, Bayer Cross, DEKALB®, Delaro®, RIB Complete® and Stratego® are registered trademarks of Bayer Group. Used under license. All other trademarks are the property of their respective owners. Bayer Crop Science Inc. is a member of CropLife Canada. ©2022 Bayer Group. All rights reserved. 1211_32500
